Executive KPI
Where are we against the scorecard, and what has held critical for months?
BuiltManufacture Terminal is a modular manufacturing management architecture that connects operational data, intelligence and executive decision-making.
This page explains why the system exists, how its management logic works, what it contains today, how it is architected, how that architecture scales — and where its current data foundation stops.
The system is real and in daily use behind authentication. The numbers shown here are not its numbers.
System at a glance
| Modules | 10 |
| Framework | None |
| Build step | None |
| Runtime deps | None |
| Access | Zero Trust |
| Status | In use |
Part one
Before any of this was software it was a management problem and a way of working through one. This part is the argument the system is built on.
Analysis existed. It was produced by every function, on its own cadence, in its own file. What did not exist was a way to turn that operational information into a shared management language, a shared performance reference, and a management rhythm that spent its time on the business rather than on the pack.
| Function | Cadence | Format | What it holds |
|---|---|---|---|
| Production | Daily | Spreadsheet | Output by line, shift notes |
| Quality | Weekly | Spreadsheet | Complaint register |
| Finance | Monthly | Slide deck | Cost centre summary |
| Procurement | Ad hoc | Price changes, quotations | |
| People | Monthly | Spreadsheet | Overtime hours |
The question that crosses all five
What did a unit cost last month, why did it move, and what would it take to move it back?
Four connected problems, each one making the next harder to solve · open each one
Each view was complete on its own terms. The relationships between them were the part nobody held — and those relationships were where the business questions lived. Cost per unit is a finance number, a production number and a quality number at once. Manufacture Terminal brings the signals together and synthesises them into one management view.
This was never only a data problem. A technical reader understands the metric immediately; management needs what sits around it. The Terminal presents operational metrics with the context, the driver and the business implication attached, which makes the same evidence readable outside the function that produced it. It does not write the narrative — it makes the material board-ready.
Without a shared performance reference, each function optimises against its own metrics and its own priorities. The Terminal puts the business metrics that matter in one place — what matters, where performance stands, what is improving, what is deteriorating, where attention is required. A shared reference can help anchor behaviour around business priorities; it does not change behaviour on its own.
Four steps of preparation stood in front of every discussion, and the discussion inherited whatever the pack happened to contain. The Terminal becomes the shared reference during the meeting itself: open it, look at the evidence, discuss the drivers, decide.
| Before | Manufacture Terminal |
|---|---|
| Function-specific reports | One unified management view |
| Technical language | Board-ready context |
| "What happened?" | "What does it mean?" |
| Individual metrics | Shared business priorities |
| Prepare, present, discuss | Open, explore, decide |
| Reporting as an activity | Performance as a way of working |
From scattered reporting to a shared management system.
Manufacture Terminal is designed around a management decision loop, not around dashboards. Each stage is a question the system has to be able to answer, and each question has a precondition. If the precondition is missing, the stage is decoration.
Most reporting stops at performance. Everything after it is where the work actually is, and that is where this system is aimed.
Five stages · open a stage for what has to exist before it can be answered
One source per number, stated. A figure whose origin cannot be named is not evidence, it is a rumour with a decimal point.
A target, a prior period, or a peer. A number on its own is not performance — performance is a comparison. This is where most reporting stops.
A decomposition that reconciles. If the parts do not add back to the whole, the explanation is a story rather than a diagnosis.
Scenarios and constraints — and what each option costs. An option without a cost attached is a preference.
An owner and a next date. Without both, the loop does not close and the next period starts from the same place as this one.
Part two
Ten modules in use today, and one of them opened up to show how a module gets designed in the first place.
Not ten dashboards. Ten questions someone actually has to answer, each with a place to go and look. What a module displays matters less than the decision it makes possible.
Built
Every module begins with the management decision it has to enable, and works backwards from there to the data. Manufacturing Finance is the fullest worked example: its framework is the most developed in the system, and its decomposition reconciles exactly.
The design framework · Manufacturing Finance
The logic underneath
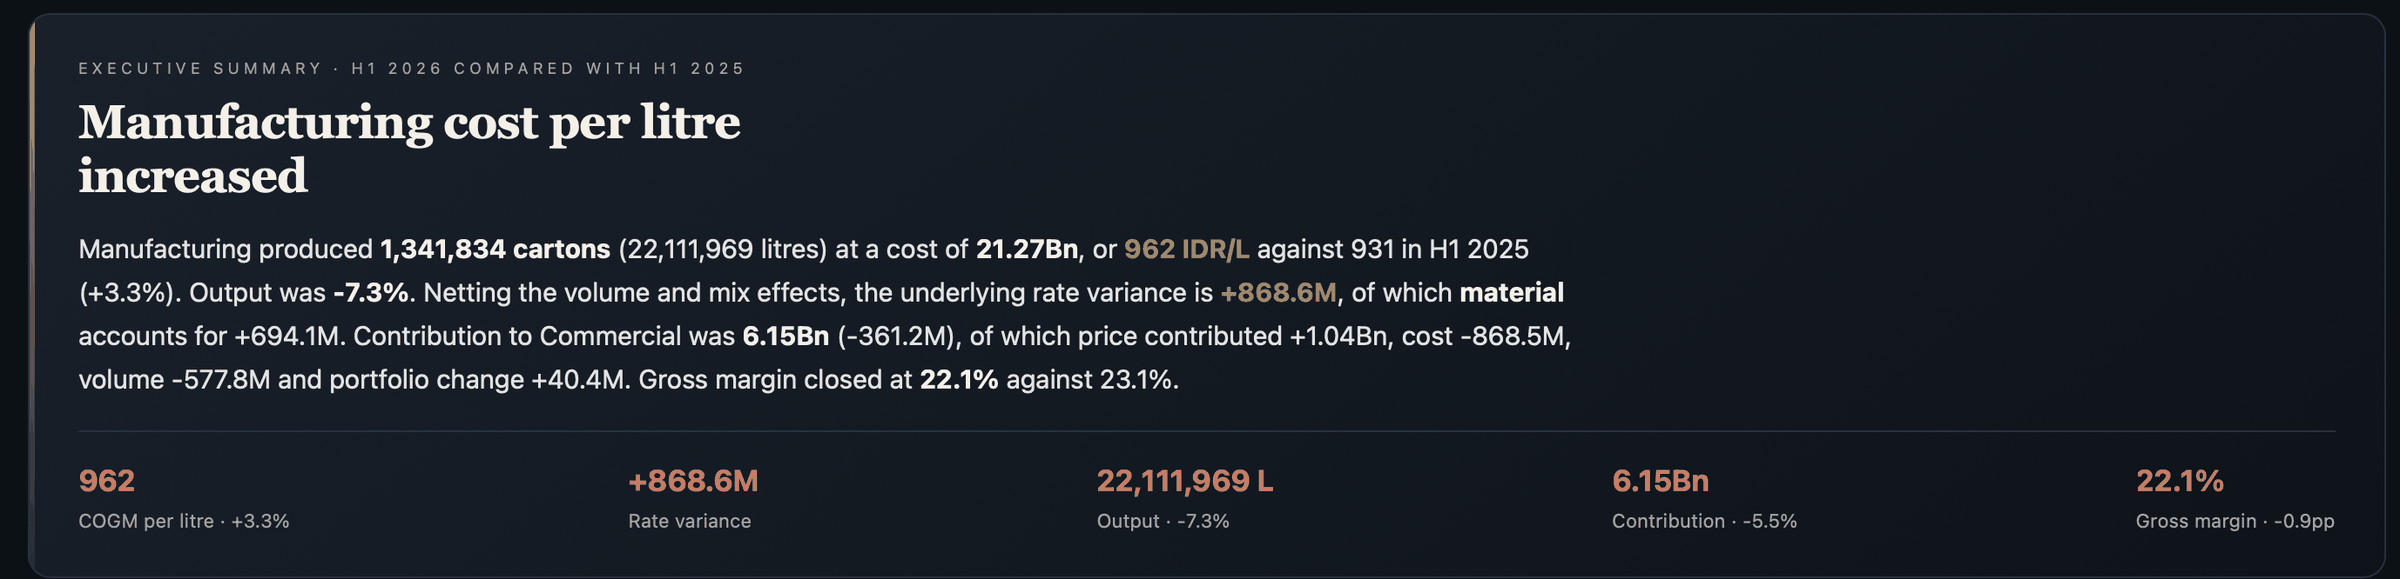
A cost per unit that moved is not yet a finding. It moved for three different reasons, and only one of them is a cost problem. Separating them is the whole job.
Part three
Two architectures that describe the same system — one in management terms, one in technical terms — and the point where ten modules become one answer.
Not the other way round. Every layer on the right is there because a stage on the left needed it — and nothing on the right is there for its own sake.
Management architecture
Data
Is this figure trustworthy?
Performance
Against what?
Diagnosis
What drove the change?
Decision
What are the options?
Action
Who owns it and what happens next?
Technical architecture
Source data
Operational records, extracted from the systems that already hold them.
Extraction
Figures are pulled, reconciled and embedded into each module ahead of time — so a review never waits on a query, and two people looking at the same period see the same number.
Cloudflare Worker
The application layer: serves each module and handles the API, with verified identity already attached.
Cloudflare D1
SQLite at the edge, alongside rather than in front — it holds what people record into the system, so a saved decision is shared rather than a copy on one laptop.
Modules
Ten self-contained modules, each answering one question.
Control Tower
Where the ten answers are read across, not down.
Management output
An executive report, and a decision with an owner against it.
Manufacture Terminal is deployed behind Cloudflare Access using a Zero Trust access model. The current authentication flow uses email-based One-Time PIN authentication.
Those are two different things, and the distinction matters. Zero Trust is the access model — every request evaluated on identity rather than on network location. One-Time PIN is the authentication method operating inside that model, and it can be changed without the model changing.
User access
Application
Data written back
Intelligence
Management
Open any component for what it does
Sits in front of the application and decides who may reach it. Nothing arrives at the Worker until Access has made that decision.
The access model. Every request is evaluated on verified identity rather than on where it came from — there is no trusted interior, and being on a particular network grants nothing.
The authentication method operating inside that model: a single-use code sent to an invited address. There is no password for the application to store, reset, or leak — and the method can change without the model changing.
The application layer. Serves each module as a static asset and handles API requests, with the verified identity Access supplied already attached.
Where a saved record is validated and stamped with who made it, without the application ever having handled a credential.
The Worker's declared connection to the database. No connection string travels with a request.
SQLite at the edge. It holds what people record into the system rather than the reported figures, which are embedded in each module ahead of time. So a decision saved by one person is the same record everyone else sees — not a copy on somebody's laptop — and a published figure cannot drift between two people reading the same period.
A lightweight, platform-native architecture without a conventional frontend framework or a dependency-heavy runtime.
Not inherently better — a deliberate choice fitted to this system's size and rate of change.
Each module has clear boundaries and joins the shared Terminal architecture without coupling its internals to unrelated modules.
Identity is verified before the application is reached, so access decisions do not live inside application code.
The Worker is the application and business-logic layer. D1 is the structured data layer. The separation keeps them independent.
Account identifiers, database identifiers, bindings configuration, environment values and internal URLs are not published here. What this section demonstrates is the shape of the architecture, not its configuration.
The ten modules produce specialised analysis. The Control Tower is where those signals are read together — a production change, a quality change, a material cost change and a procurement change are four reports in a functional structure, and one business event when read as one.
The Control Tower is the synthesis layer where specialised module analysis becomes one management view. In the product it resolves to six: factory state, unit economics, cost bridge, product economics, performance matrix, and where the pressure is.
Control Tower · synthesis
Executive report · .docx
Management · decision
Part four
Where additional capability attaches without the core being rebuilt, and where the current data foundation stops.
The system is designed so that new capability attaches to shared data, shared logic and a shared point of convergence, without the core being rebuilt. The eleventh module requires no change to the first ten.
New modules are built against a written brief rather than against the core, so extending the system does not mean reopening it.
The stack is what makes that true: capability attaches at a defined layer rather than being threaded through the ten modules that already exist.
Scalability is a claim. This is the seam that supports it — inspectable rather than asserted.
A module supplies
It receives, without core changes
Analysis is bounded by the data the source systems actually capture. Where a source system does not record something, the current architecture cannot produce a reliable figure from it — and the system does not produce an unreliable one instead.
Everything outside that boundary is absent from the system, and is not presented as fact anywhere in it.
A number that cannot be defended is worse than a gap, because a gap is honest.